
Insights
See how your agents are doing — how much the AI handles alone, what people ask, and what it can't answer.
The Insights tab turns your conversations into a dashboard. Pick a time range (7, 30 or 90 days) and, if you run more than one agent, filter to a single one.
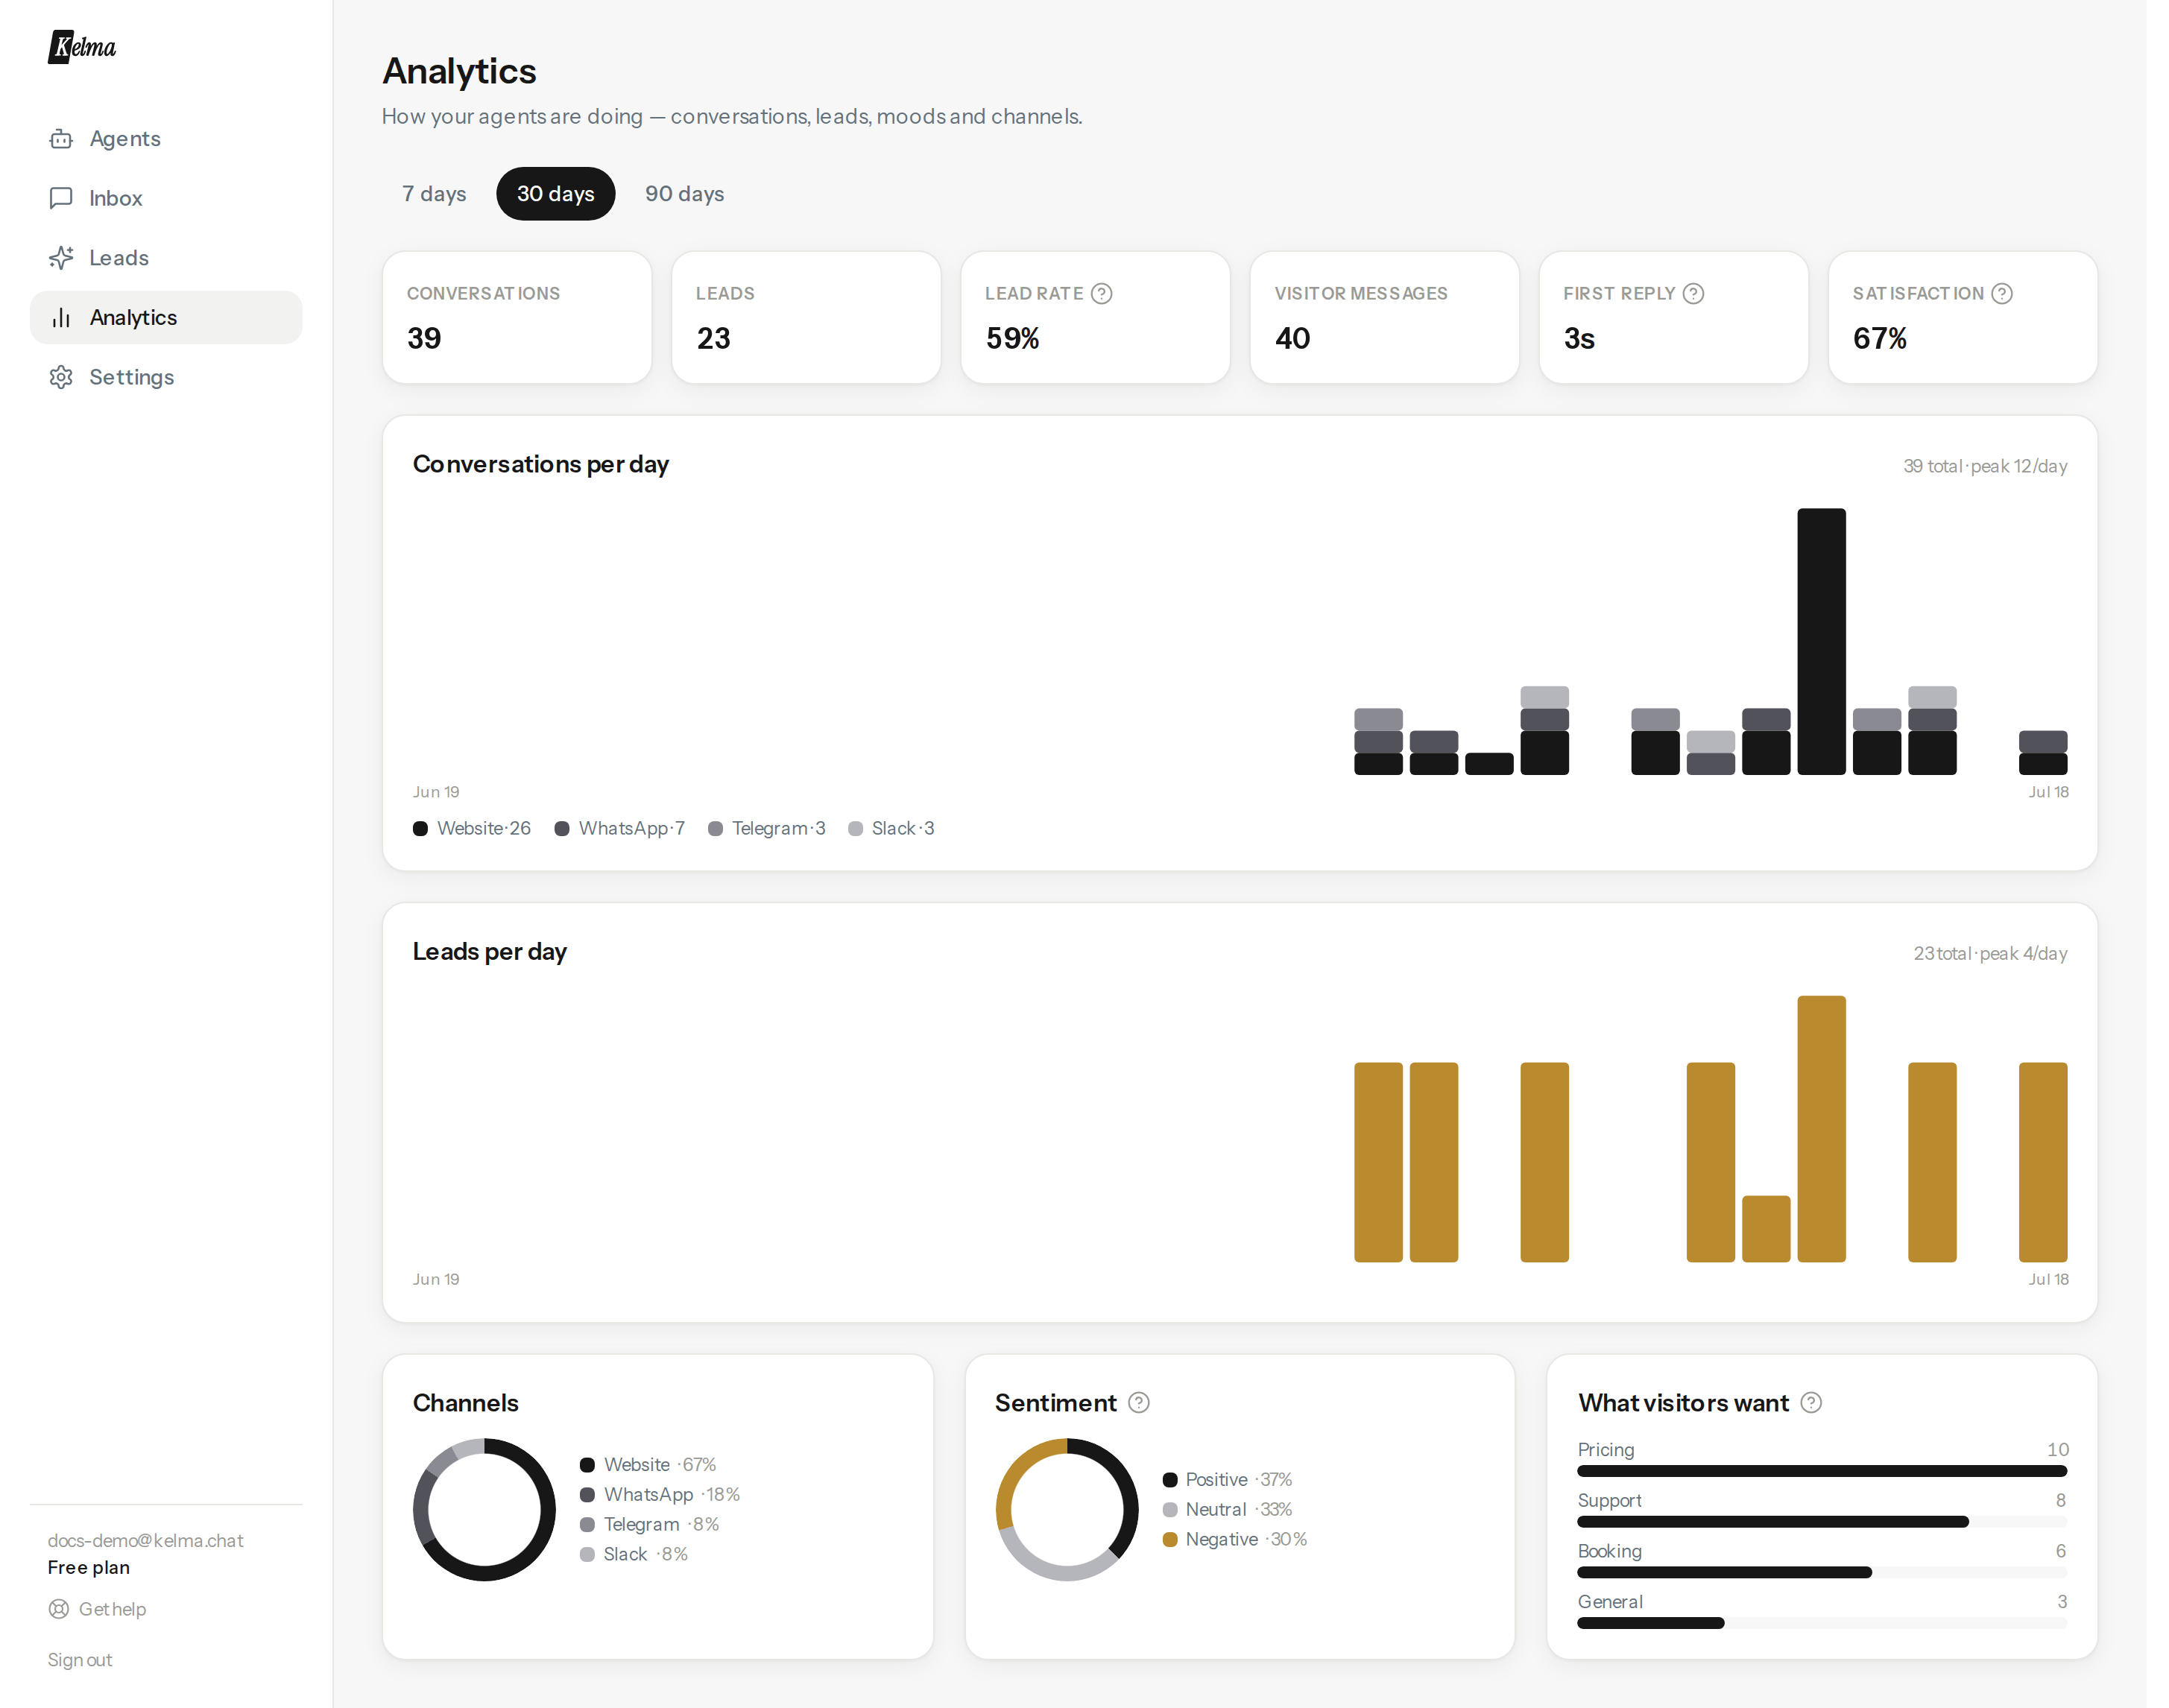
The numbers at the top
- Conversations — how many chats started in the period.
- Handled by AI — the share that finished without a person stepping in. This is the number that tells you what the agent is actually saving you. A chat that was flagged for handoff but never picked up does not count as handled.
- Leads and Lead rate — captured contacts, and what share of conversations became a lead. A rising lead rate means the agent is qualifying better.
- Visitor messages — total questions asked, a truer measure of engagement than conversation count.
- First reply — the average time to the first streamed word. Kelma is typically 1–3 seconds; a spike usually means a cold start after a quiet period.
- Satisfaction — the share of 👍 among all visitor votes on replies (the thumbs under each answer). Only shows once visitors have voted.
- Closed — how many conversations you've marked closed in the Inbox, so you can see whether the queue is being worked.
- Messages per chat — average conversation length. A rising number often means the agent is working harder to reach the same answer, which usually points at the knowledge base.
Knowledge gaps
The most useful list on the page. Every row is a question a visitor asked where the agent found nothing in its knowledge base — it answered from its instructions alone, or admitted it didn't know. The count is how many people have already asked.
Treat it as a to-do list: add a page (or a Q&A pair) covering the top rows and the agent stops guessing. Questions are grouped, so one thing asked forty times is one row, not forty.
The charts
- Conversations per day — daily volume, split by channel so you can see whether Website, WhatsApp, Telegram, Slack or the API is carrying the load.
- Leads per day — the same view for captured contacts.
- Channels — the share of conversations by where they happened.
- Sentiment and What visitors want — the mood and intent of conversations, drawn from the AI insights each chat gets after it goes quiet. "What visitors want" is the fastest way to spot a gap: a big pricing or support slice tells you what to put front-and-centre.
- Busiest hours — when chats start, in UTC. Worth checking before you decide when someone should be around to take a handoff.
- Pages people chat from — which pages send visitors to the agent. Website widget only; a WhatsApp or email thread has no page.
Everything is computed live from your data — nothing to set up, and it updates as conversations come in. For per-conversation detail, open the Inbox; to pull the raw rows into a spreadsheet or BI tool, use the CSV exports on Inbox and Leads, or the API.